About
CASA supports Google Chrome and Microsoft Edge browsers.
In CASA, users can:
- Browse or search AS events across different body sites (including lung, colon, etc.) and different disease stages (including healthy, convalescent, moderate, severe, etc.);
- Browse or search AS related functional annotations between groups in each independent dataset;
- Explore potential drugs for genes with differentially alternative splicing level;
- Explore potential regulators associated with dynamic AS events;
- Perform analysis for alternative splicing by submitting new transcriptome data (FASTAQ or BAM formatted files);
- Download all results and figures for further research.
Citation:
CASA: a database for genome-wide identification of COVID-19-related alternative splicing eventsURL: http://www.splicedb.net/casa
News
Help
{{ helpList[0] }}
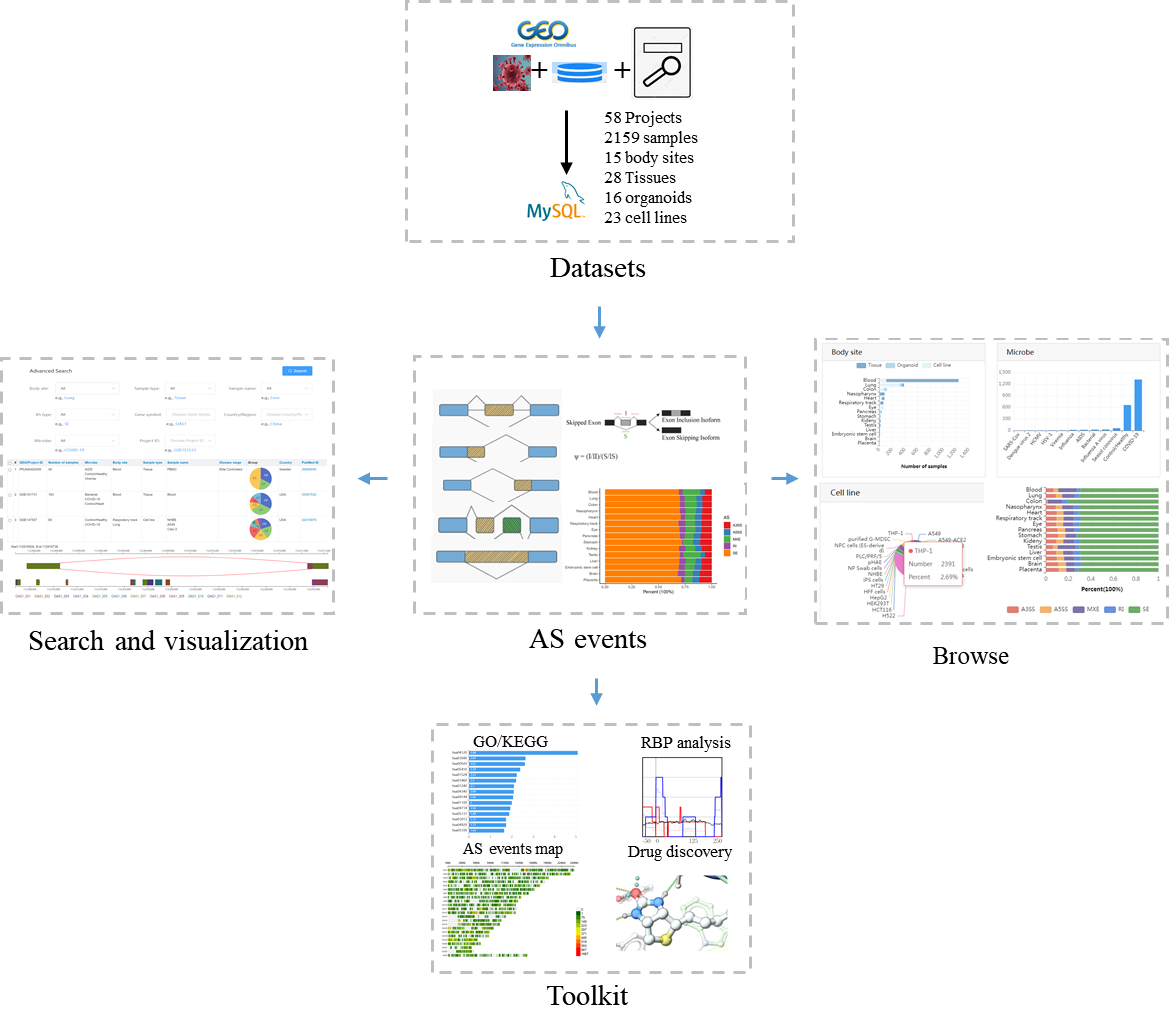
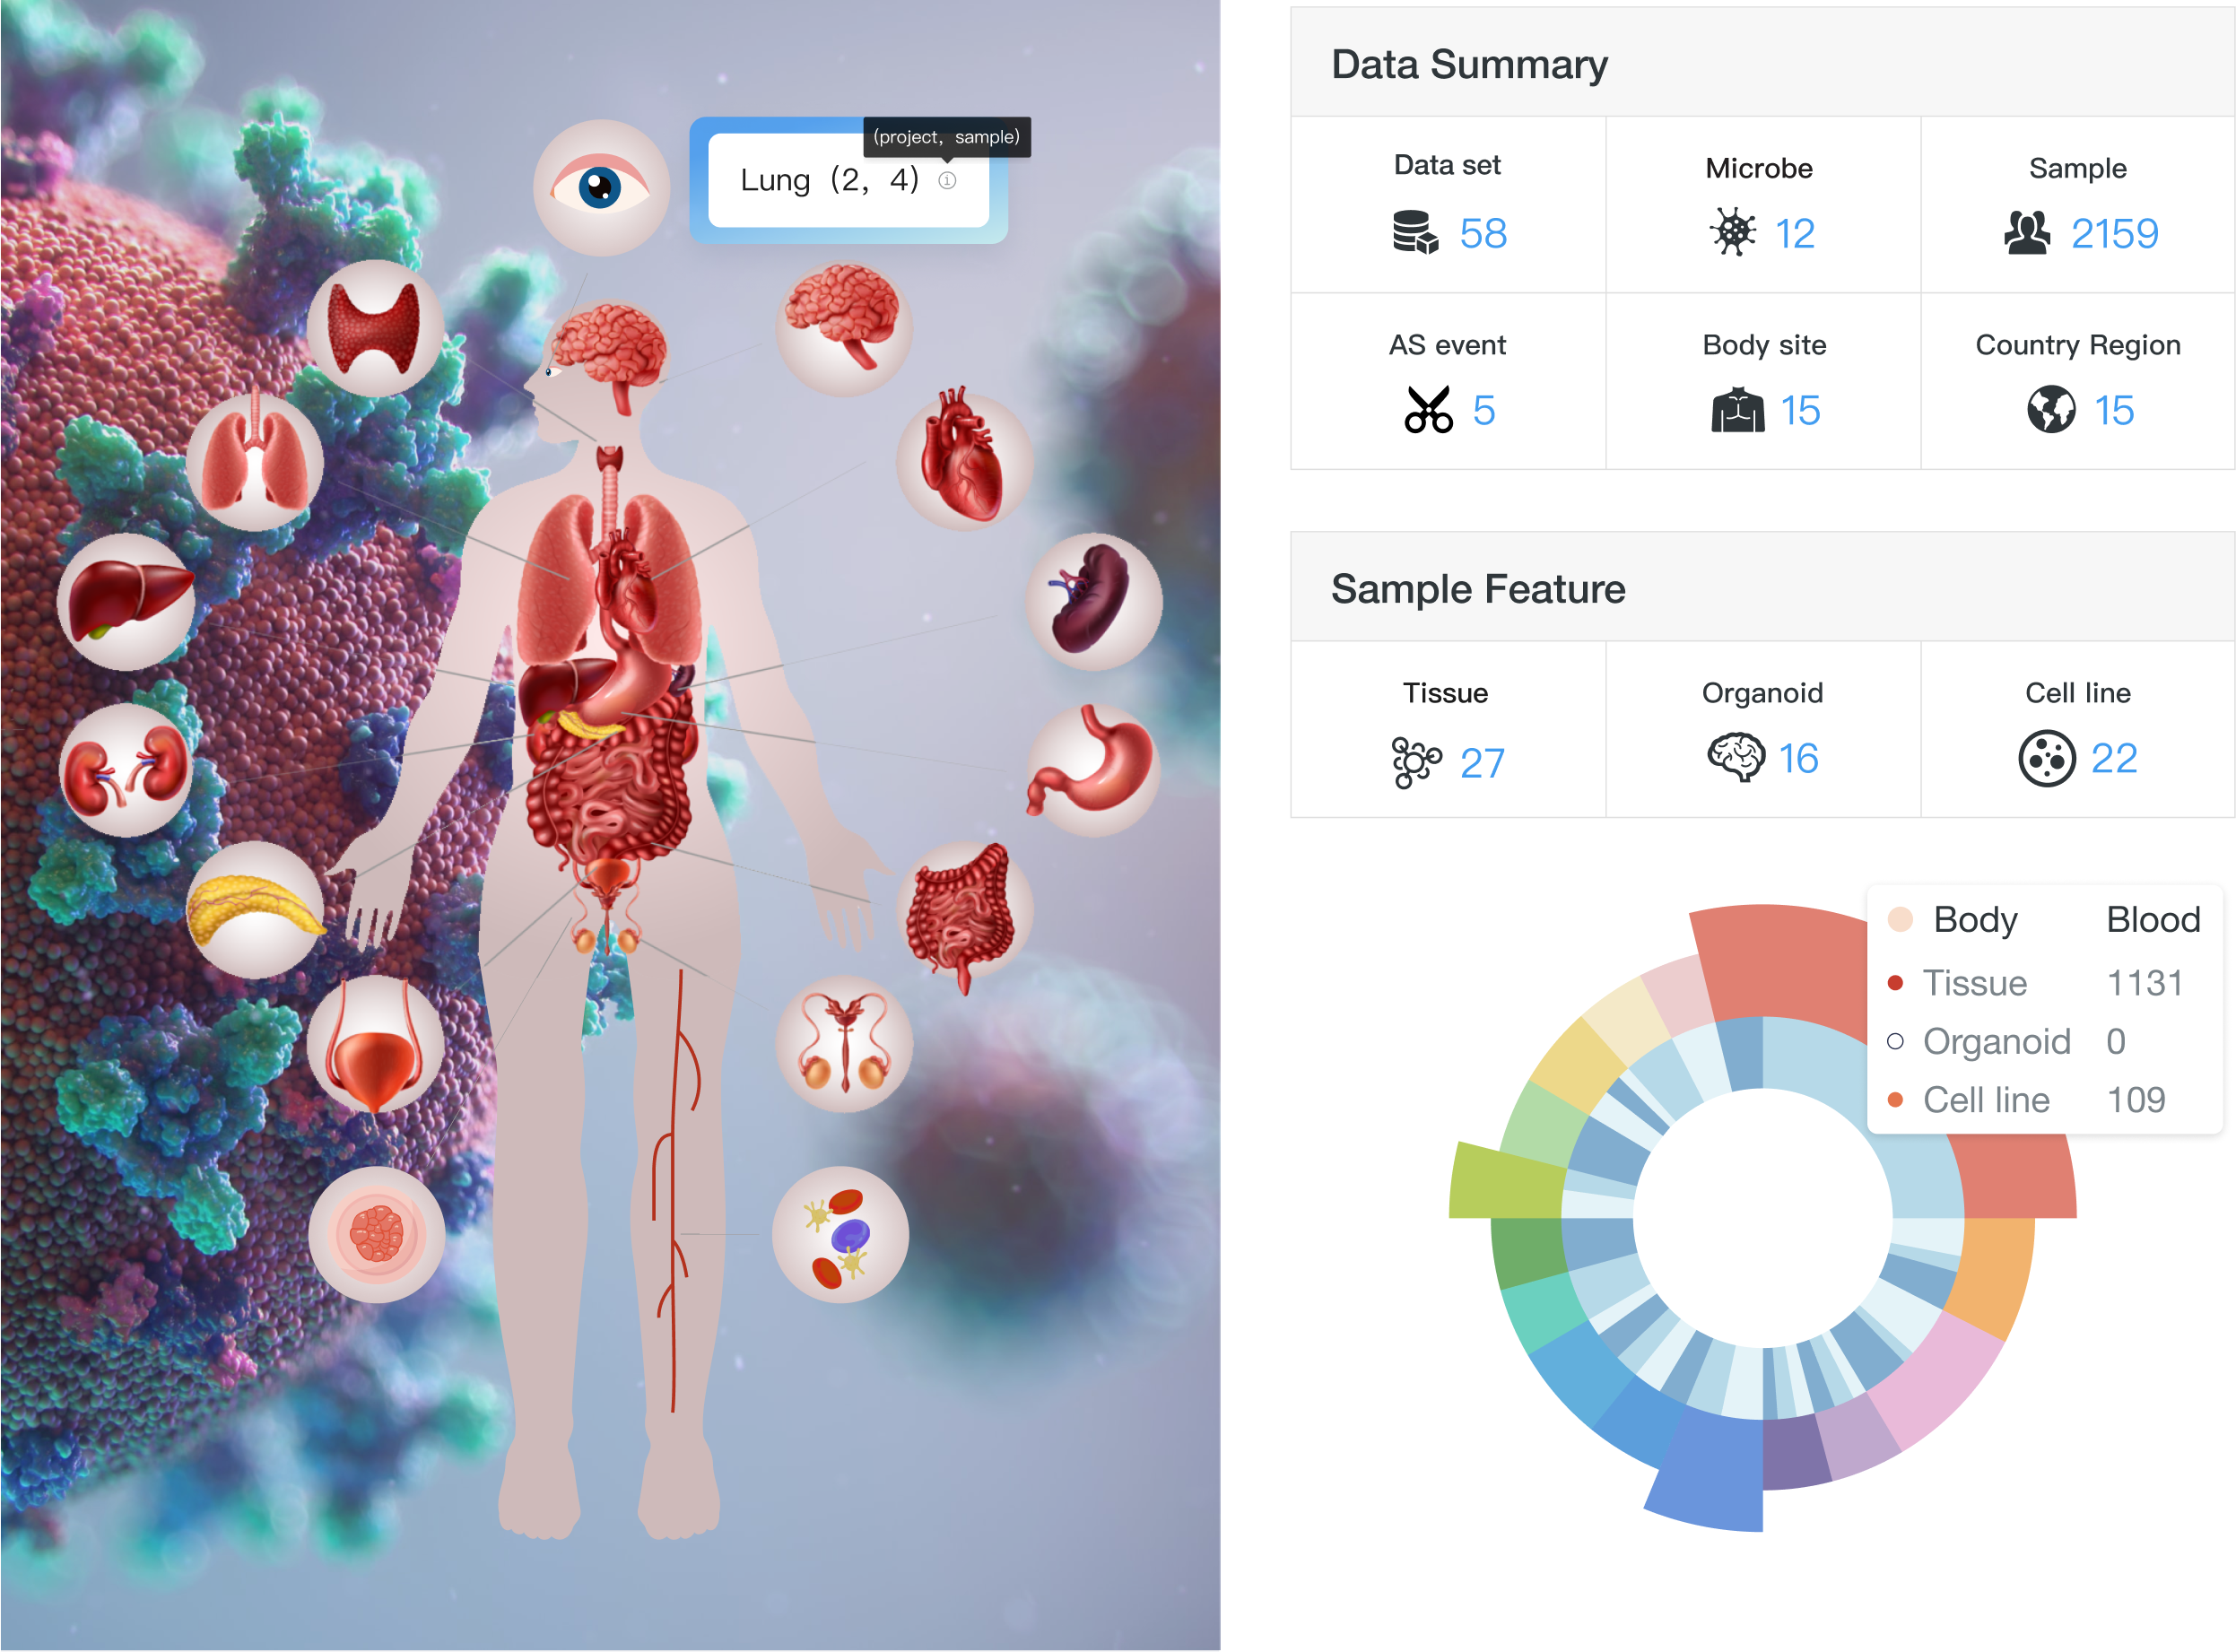
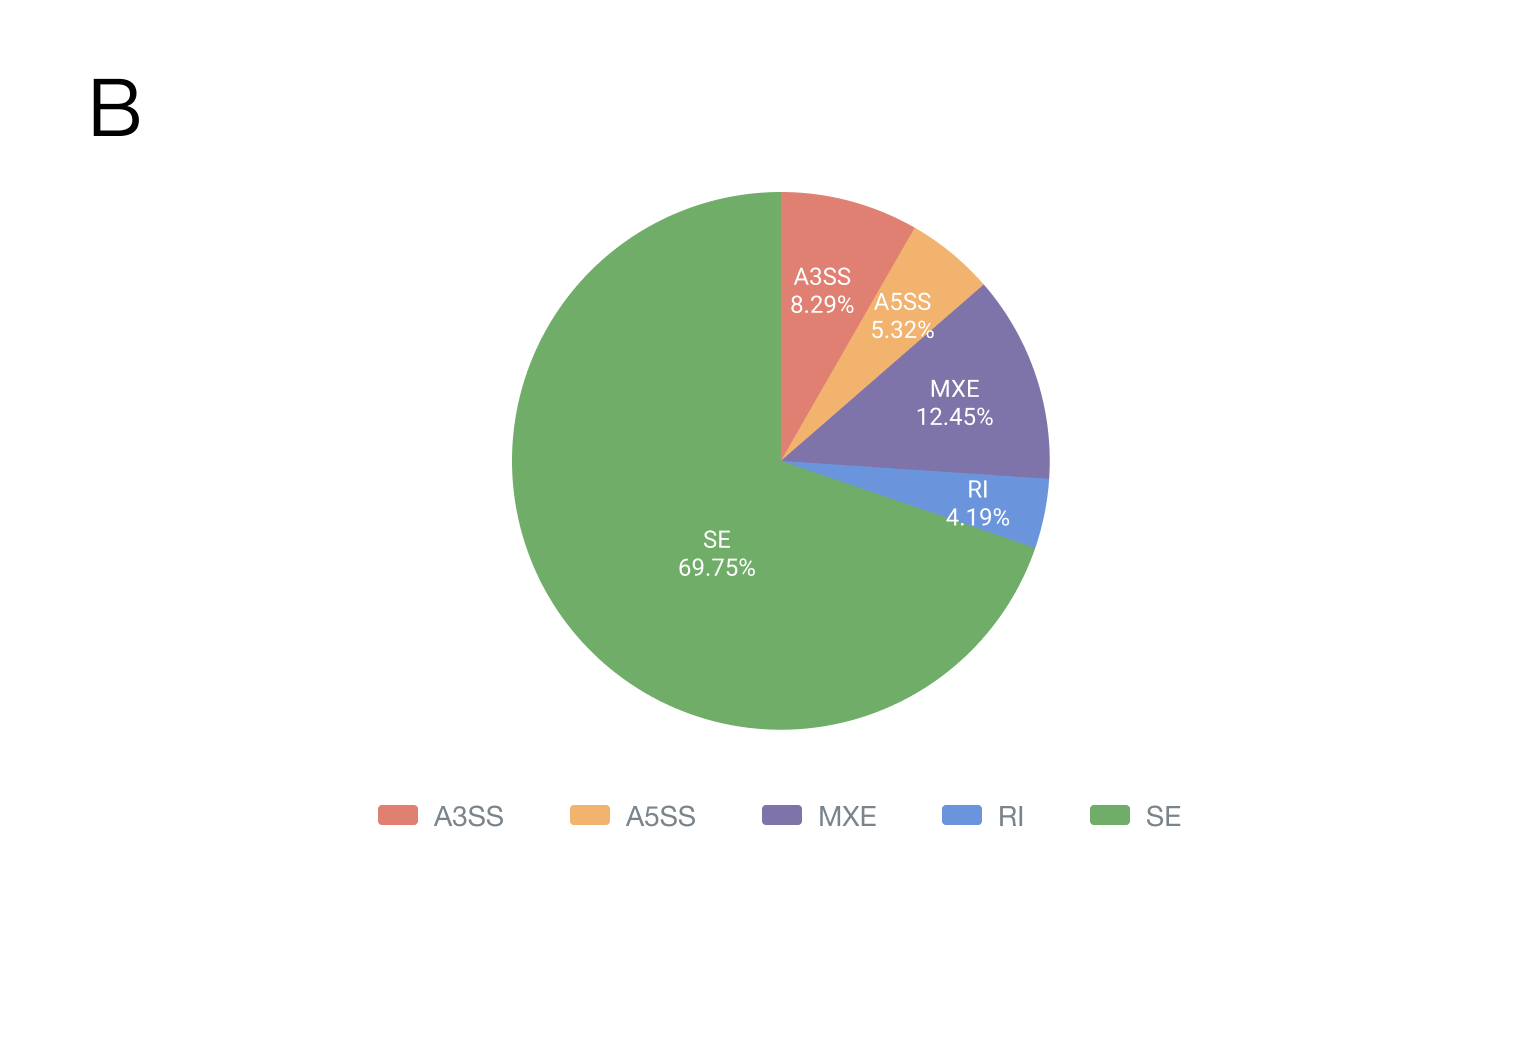
The CASA is an alternative splicing (AS) database that assists the user to identify COVID-19-related AS events at whole transcriptome scale. CASA was constructed by applying rMATS methods to RNA-seq samples from 15 human body sites, covering 2,159 samples and 27 tissues, 16 organoids and 22 cell lines. Totally, 5,340,848 SE, 407,556 A5SS, 634,455 A3SS, 953,142 MXE and 320,844 RI were identified and CASA provides search and visualization functions for identification of splicing pattern differences between biological states or treatment conditions.
In CASA, users can:
- Browse or search AS events across different body sites (including lung, colon, etc.) and different disease stages (including healthy, convalescent, moderate, severe, etc.);
- Browse or search AS related functional annotations between groups in each independent dataset;
- Explore potential drugs for genes with differentially alternative splicing level;
- Explore potential regulators associated with dynamic AS events;
- Perform analysis for alternative splicing by submitting new transcriptome data (FASTAQ or BAM formatted files);
- Download all results and figures for further research.
{{ helpList[1] }}
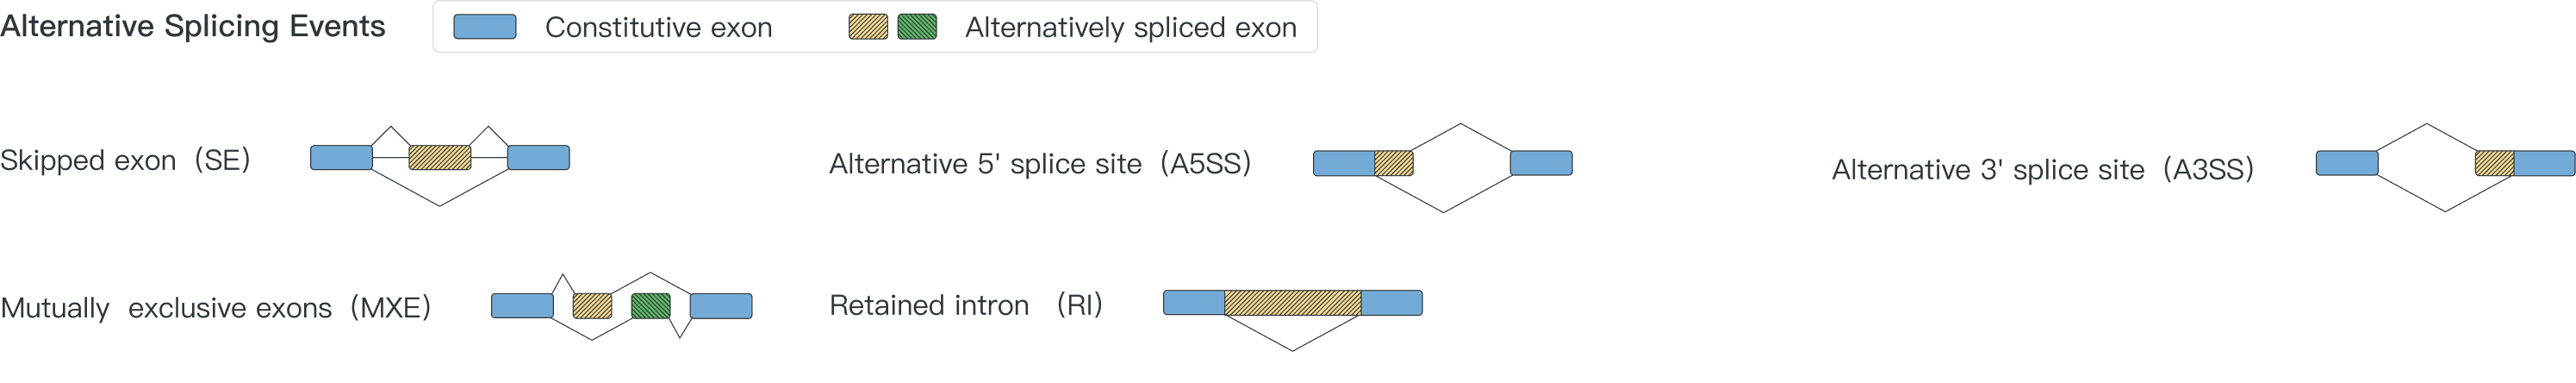
A splicing event is a change in splicing patterns in a multi-exon gene among samples. In CASA, five different types of splicing events are detected:
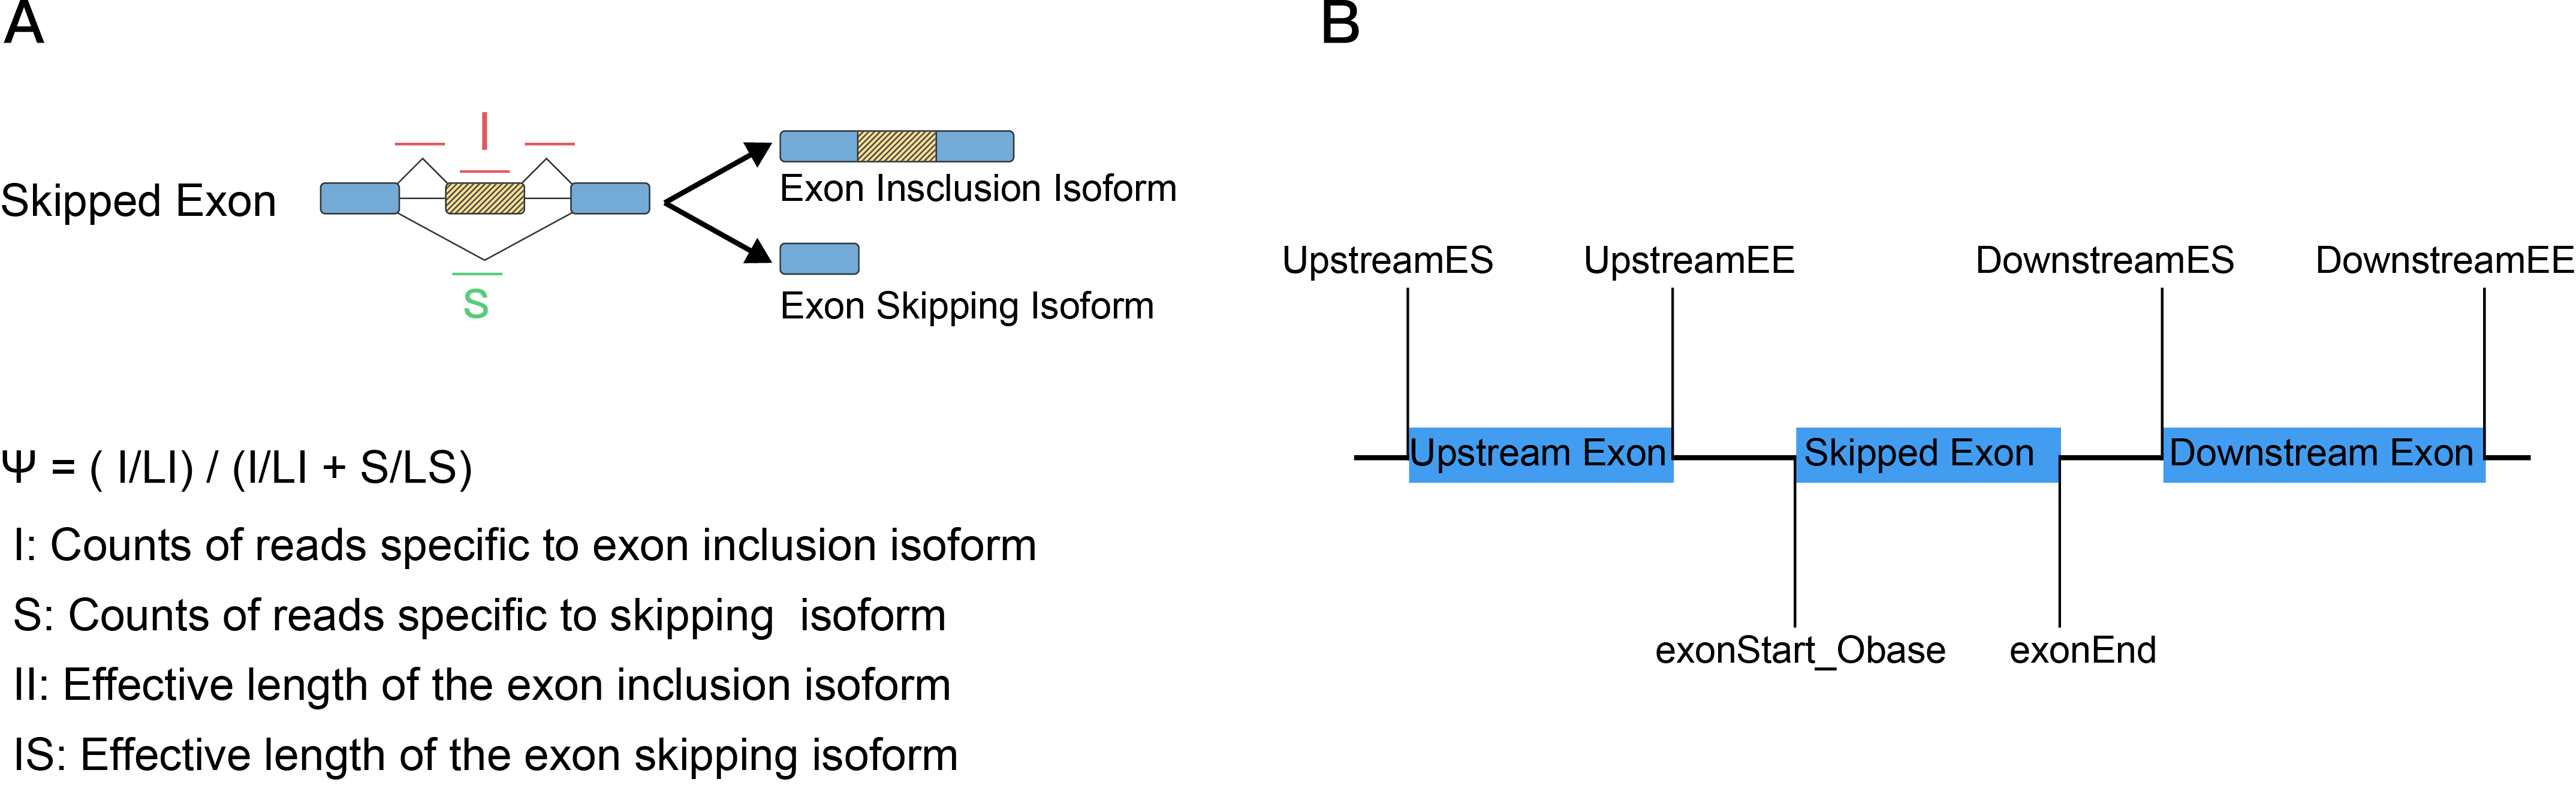
How can splicing event be quantified?
All alternative splicing events were identified and quantified at whole transcriptomic scale by using rMATS paired/unpaired model. For each sample, every possible splice event (e.g., an exon skipping event) was estimated as a ψ value that is similar to percent-splice-in (PSI). For a skipped exon, the exon inclusion level ψ can be estimated as the formula (Figure A). The exon inclusion reads are the reads from the upstream splice junction, the alternative exon itself, and the downstream splice junction. The exon skipping reads are the reads from the skipping splice junction that directly connects the upstream exon to the downstream exon (Figure B).
{{ helpList[2] }}
{{ helpList[3] }}
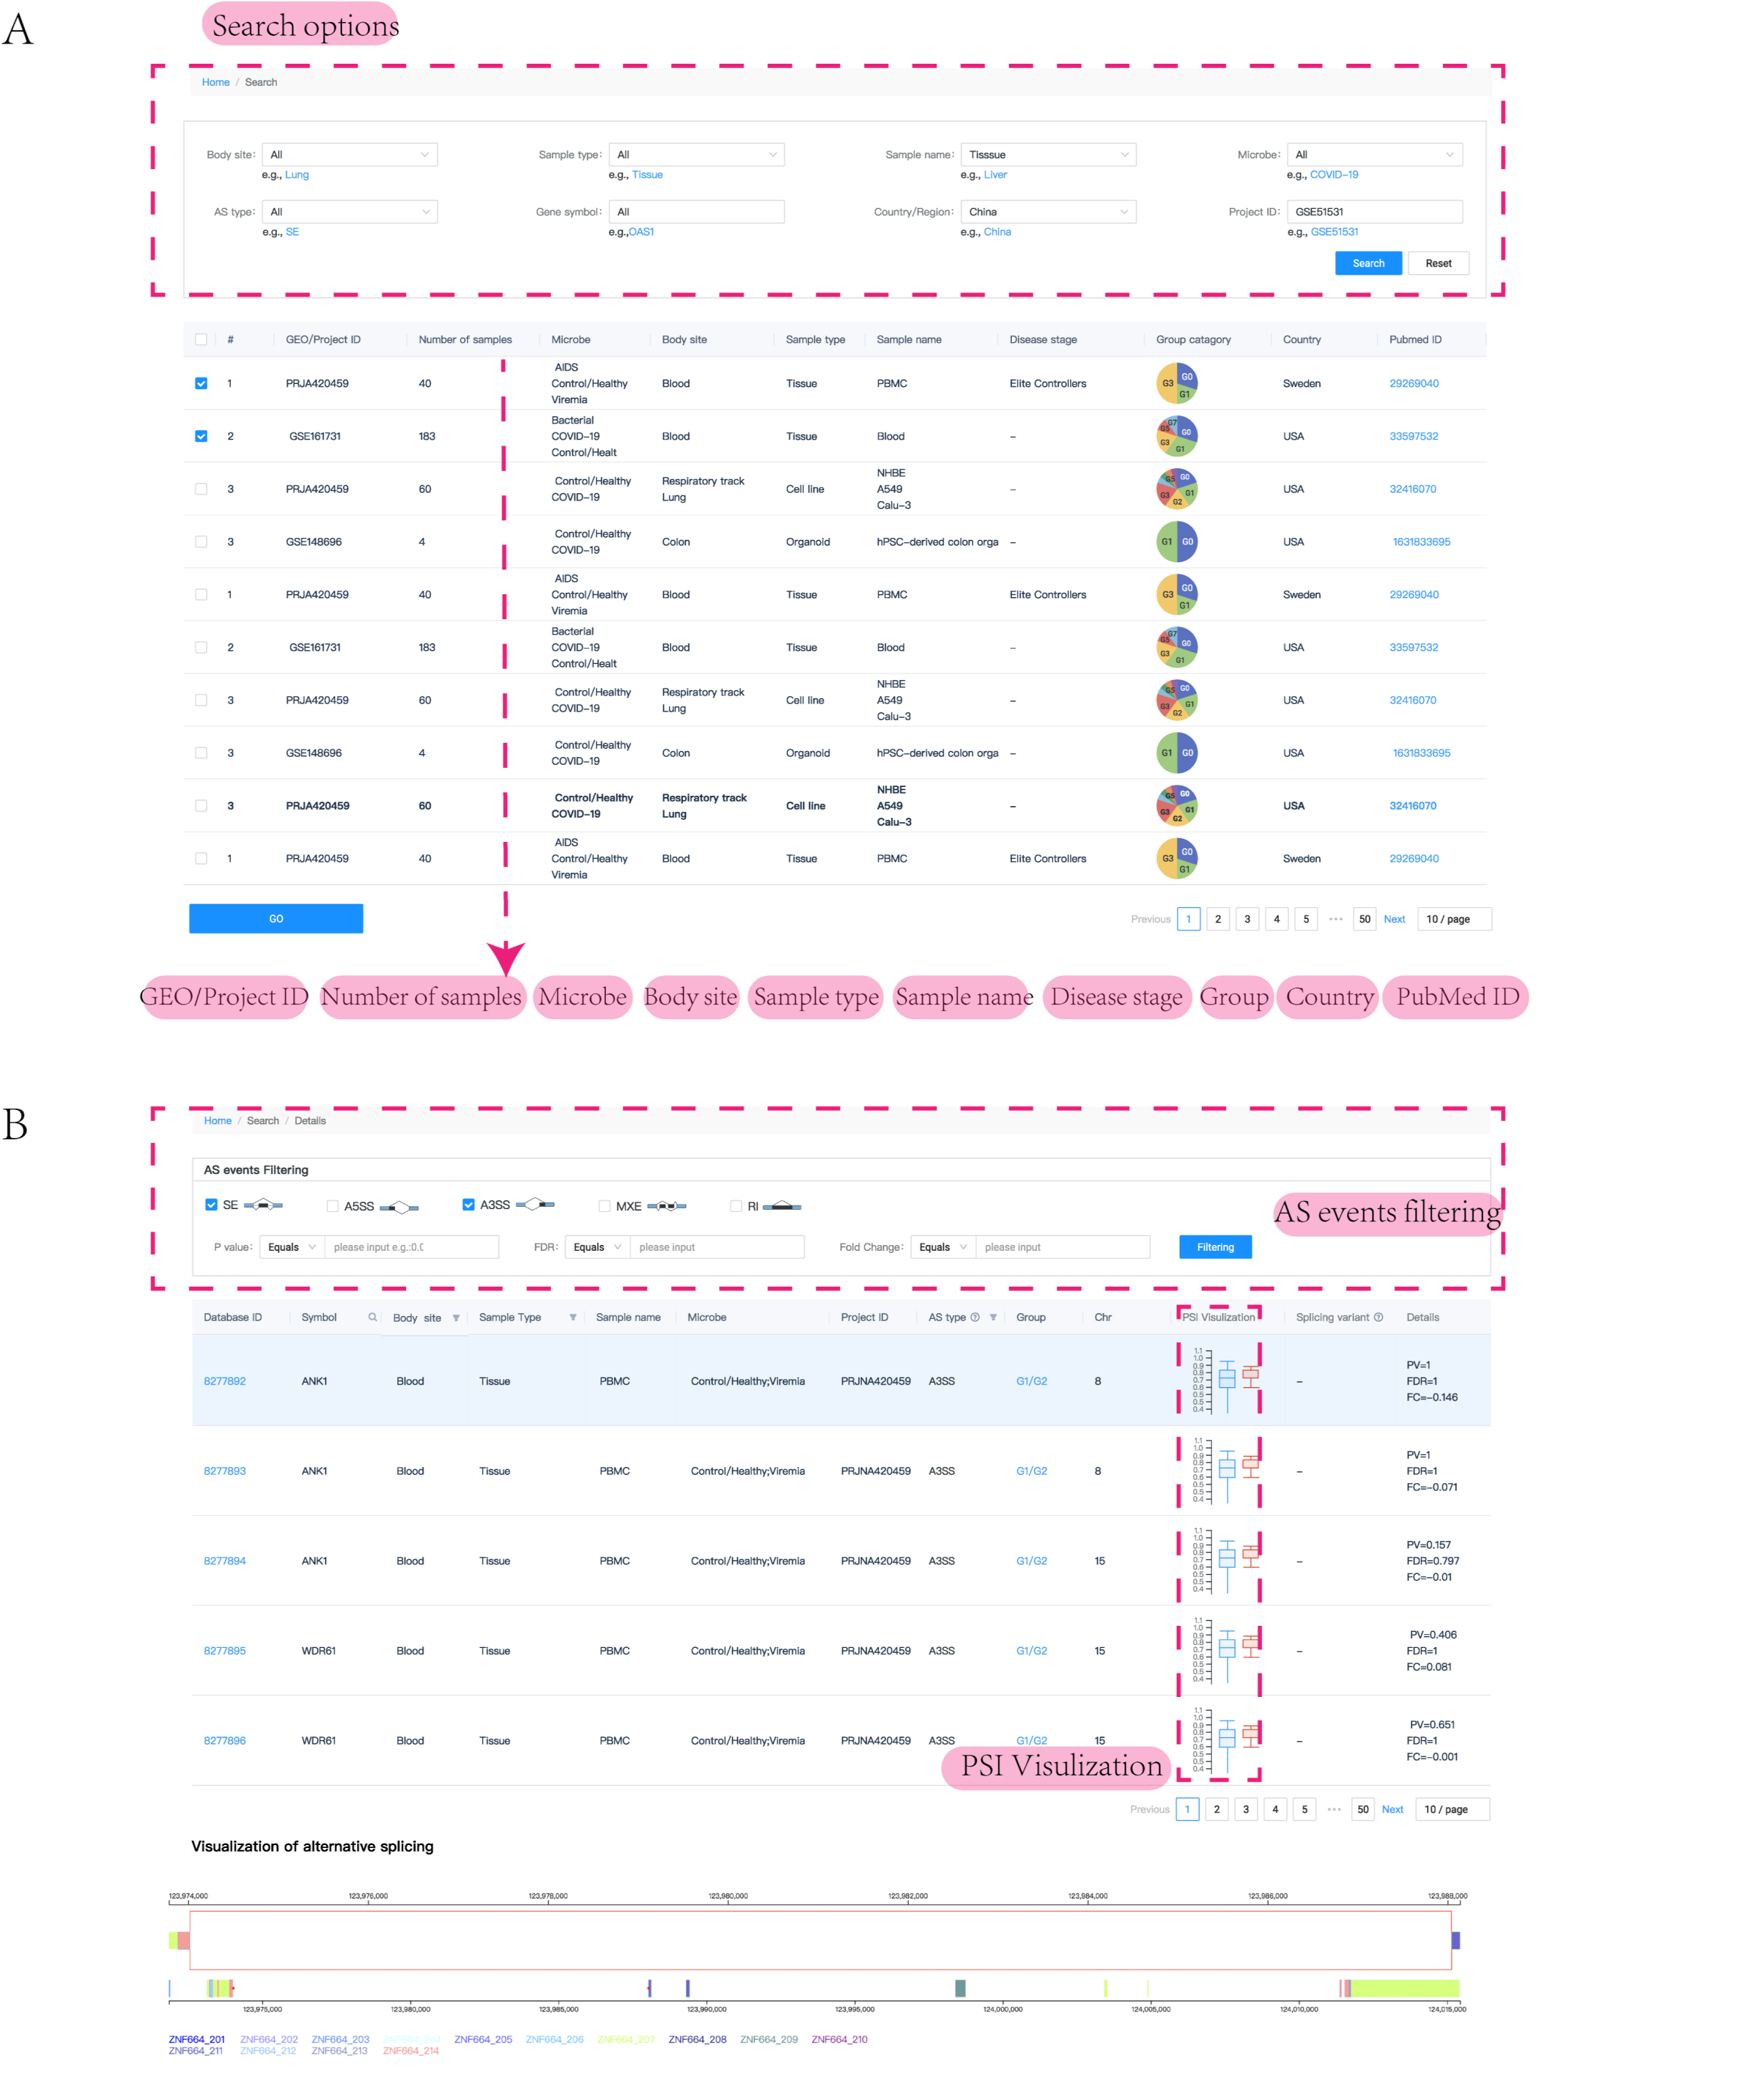
CASA is a user-friendly web interface that provides to allow users to query the database through multiple criteria, such as sample type, sample name, microbe, gene symbol or dataset (Figure A). Once one or more datasets are selected, result tables are shown and the splicing event can be visualized (Figure B). There were several sections in the detail page. First, the filter criteria for AS events were shown in the top of the page, such as AS type and the statistical criteria. Then the detailed information of AS events, such as location, project ID and related clinical information, were shown in the middle of the page. The basic information of AS events, for example the exon inclusion level of each sample, could be obtained by clicking 'Database ID' in the result table, and the distribution of the exon inclusion levels of each sample was compared between two different groups. Subsequent splice graph of the splicing event was shown in the bottom of the page, providing the read distributions across the different exons.
{{ helpList[4] }}
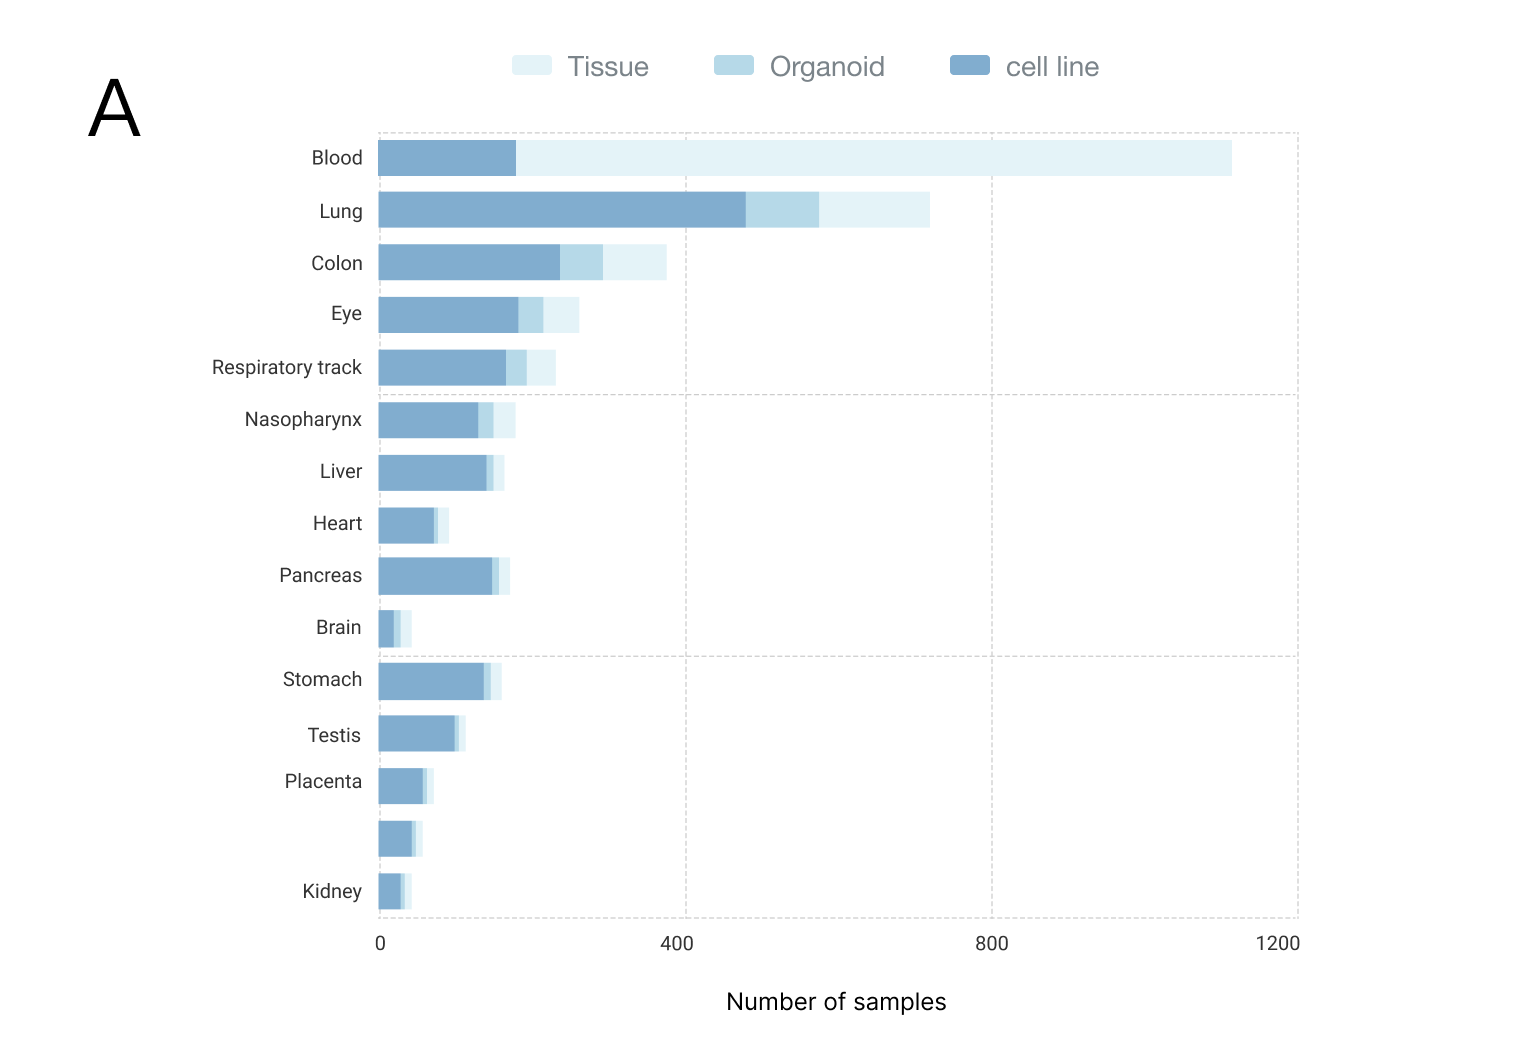
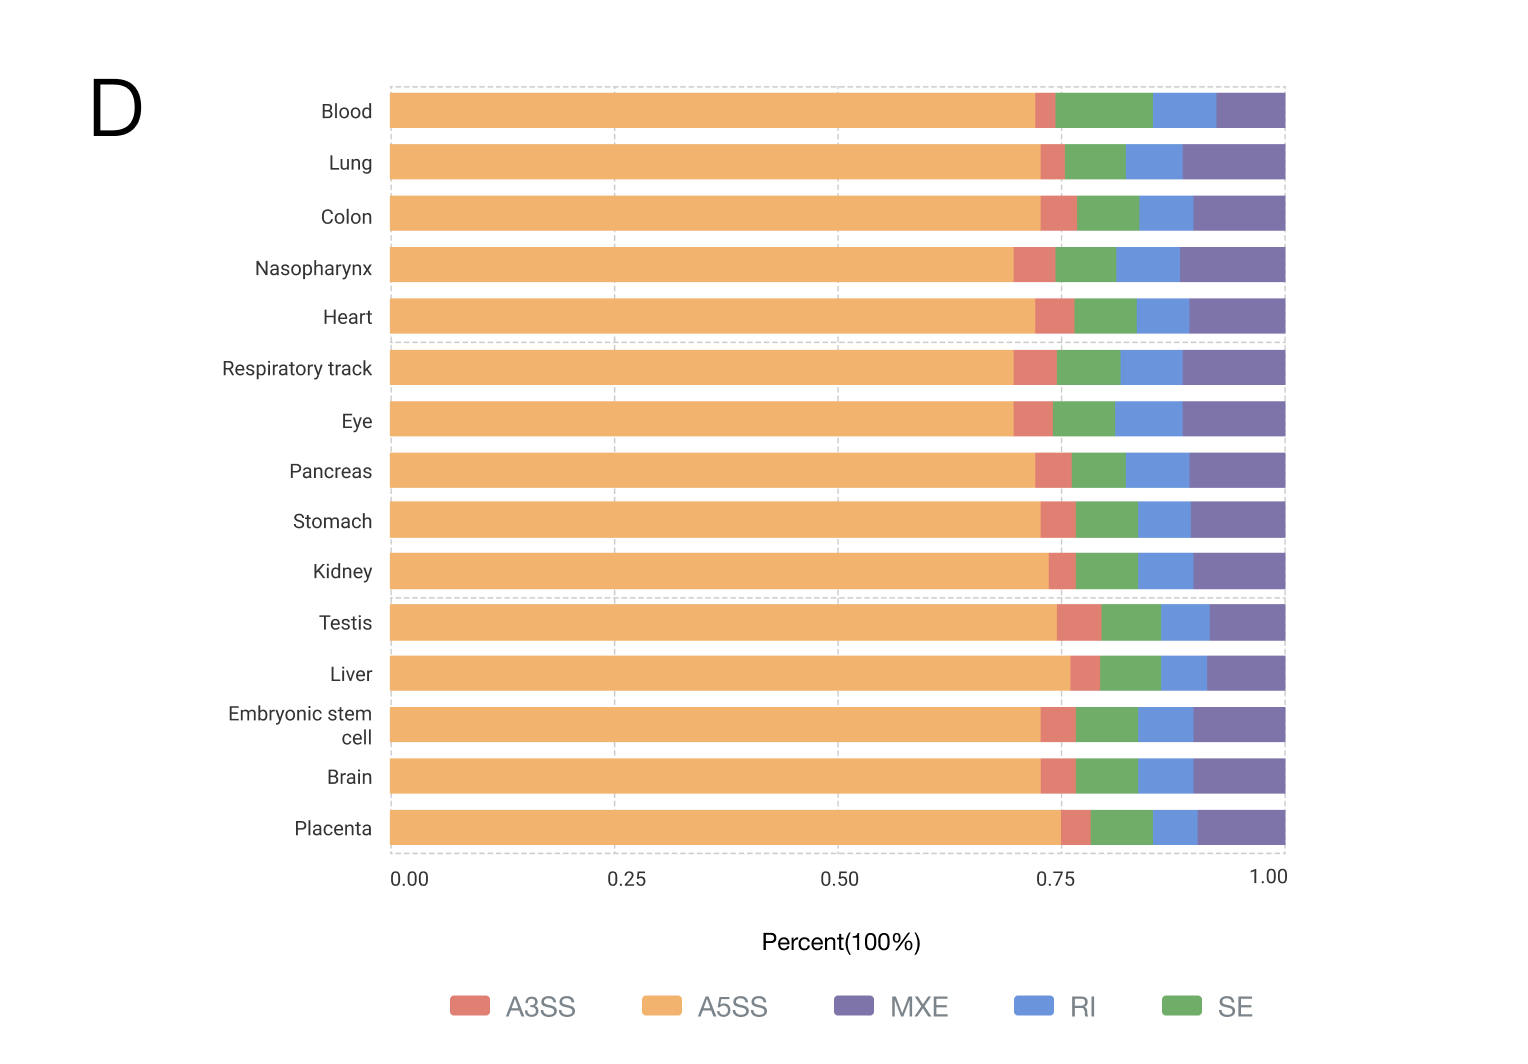
Currently, CASA includes a total of 2,159 human samples from 58 independent datasets, covering 15 body sites, 11 microbes and 15 countries/regions (Figure). Of these samples, the most (64.47%, 1392/2159) were generated from tissue, and the second (28.35%, 612/2159) was from the cell line. The top three body sites are the blood, lung and colon, and the top three countries are the USA (56.14%, 1212/2159), France (19.92%, 430/2159) and Spain (4.72%, 102/2159). Samples from tissues, organoids or cell lines under different conditions were collected, including disease severity (mild, moderate or severe COVID-19), infection time and therapy. This related phenotype/clinical information helps us infer the condition-specific splicing patterns, as well as their potential regulators.

{{ helpList[5] }}
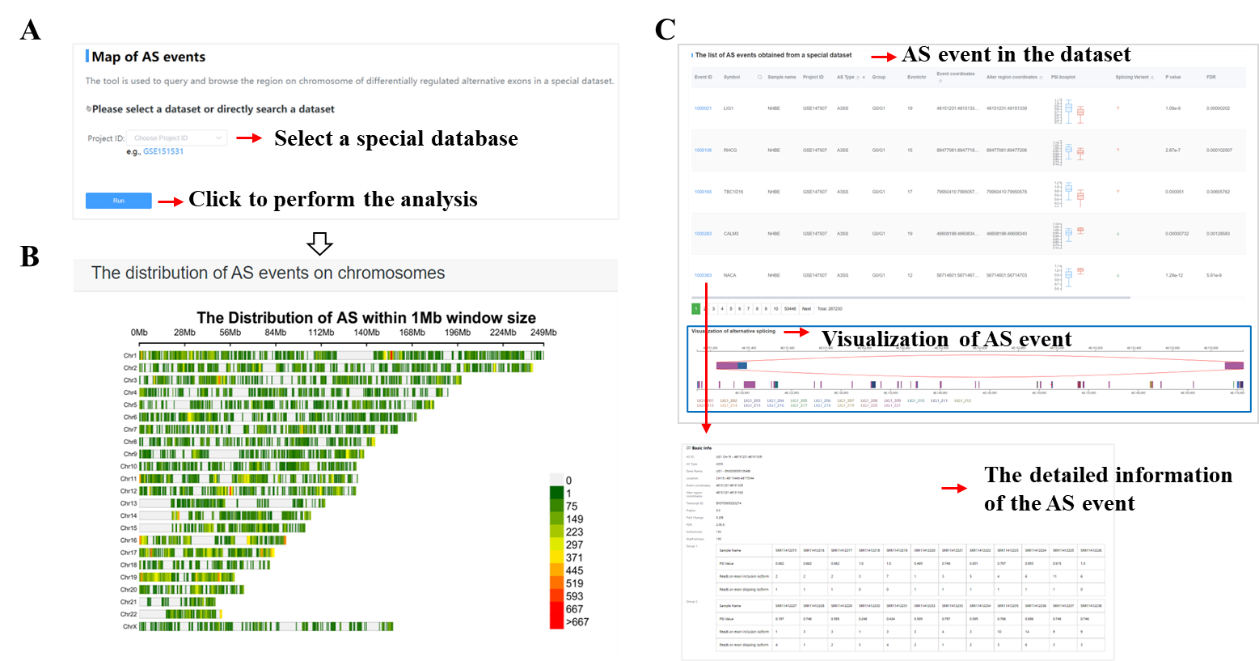
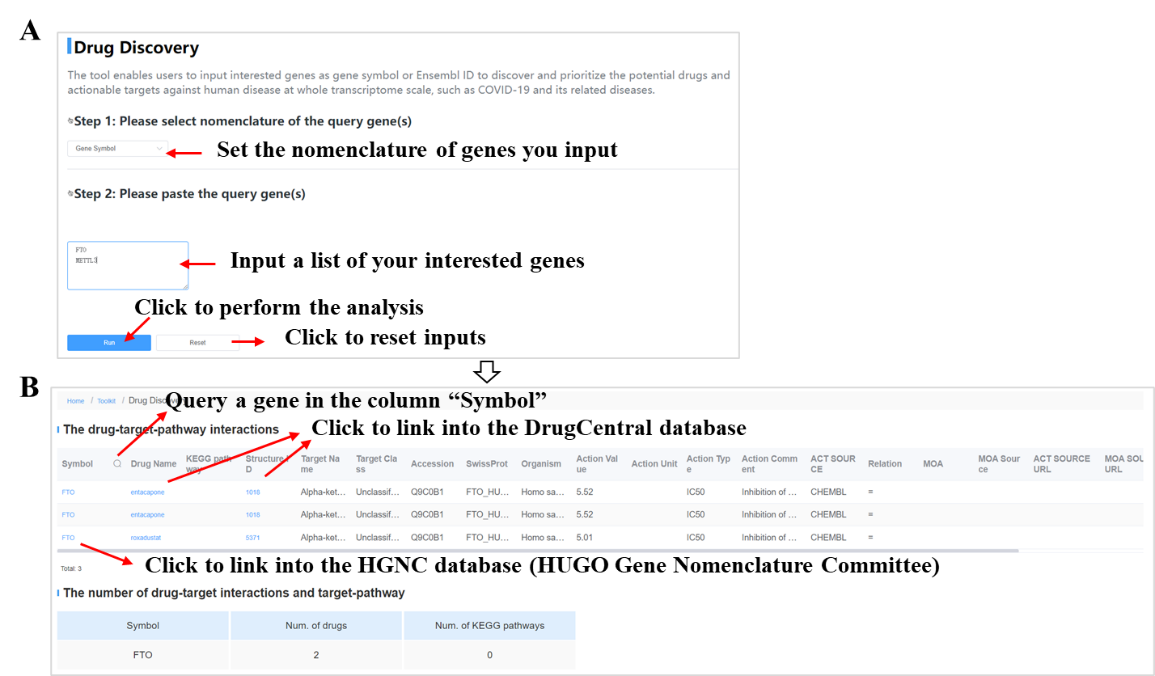
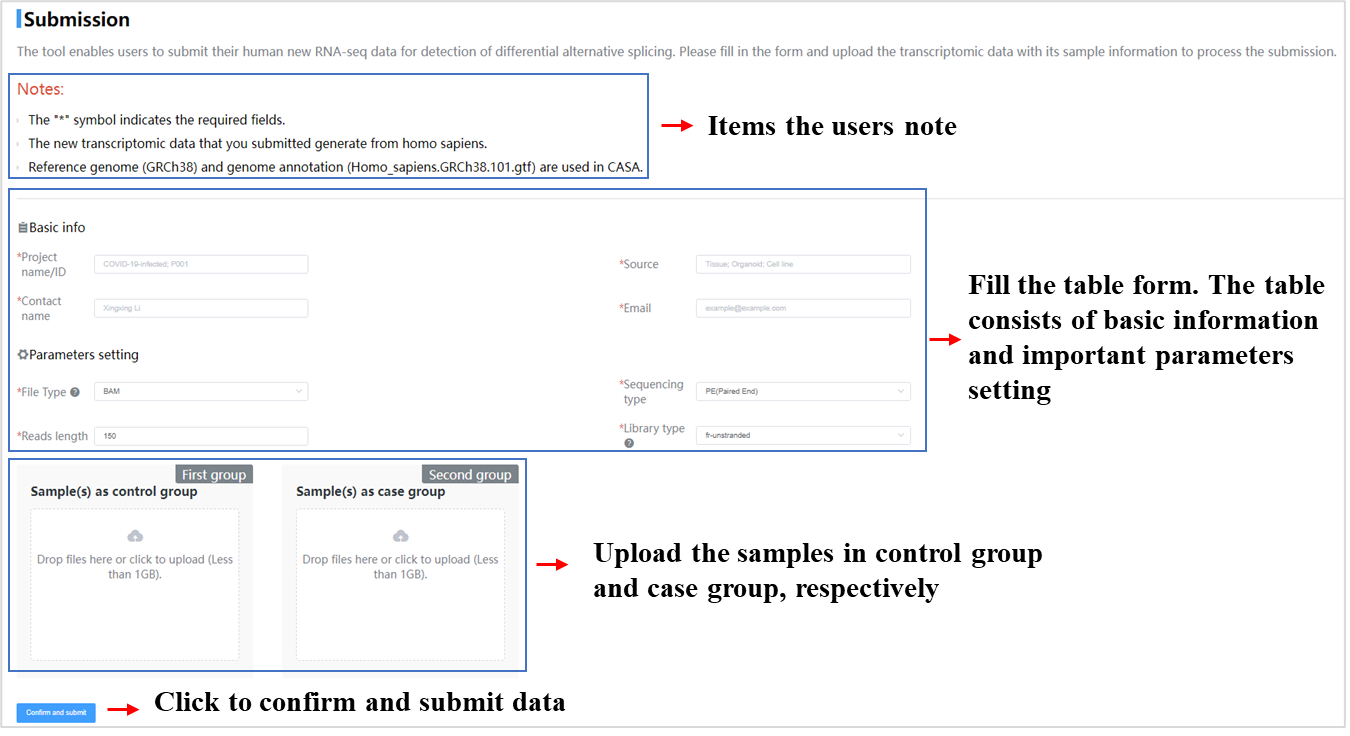
Currently five toolkits were embedded in CASA, including GO/KEGG enrichment analysis, RBP prediction, map of AS events, drug discovery and submission. The tutorial of those toolkits as follows:
6.1 GO/KEGG Enrichment Analysis
The GO/KEGG enrichment analysis is a helpful application to discover and identify the biological function of genes with significantly differential alternative splicing events in the specific physiological and pathological condition. Once a special dataset the user chooses, the results are displayed as bar plot and the bar plot can be freely download and saved as a PDF file with high resolution. As GO enrichment analysis an example, the query page and the result page are shown below.


Download
Thousands of RNA-seq data generated from COVID-19 and COVID-19-related specimens were enrolled in CASA. All relevant clinical/phenotype information were manually collected and integrated, including disease severity (e.g., mild, moderate or severe COVID-19), cell types, and infection time, etc.
- Detailed information of all datasets
- Genome annotation
- Fastq to AS Event bash shell
download dataset (MD5:8f39fad7a1ae2d5c677da4cdb080aaa4)
Download Homo_sapiens.GRCh38.101.gtf (MD5:1fa19d4386a624e266ddf153ff0380c5)
Download bash shell for AS Event (MD5:13befa8cb465bb7d9d887a63e0ad8091)